.webp)
%2B(7).webp)
.png)
At a Glance
An InBody scan gives you a detailed breakdown of your body composition—muscle mass, body fat percentage, and water distribution—using bioelectrical impedance analysis technology. This data reveals far more than your scale weight ever could, helping you set realistic nutrition and fitness goals based on what's actually happening inside your body. Understanding these metrics empowers you to track meaningful progress and make evidence-based decisions about your health.
What Exactly Is an InBody Scan and What Does It Tell You?
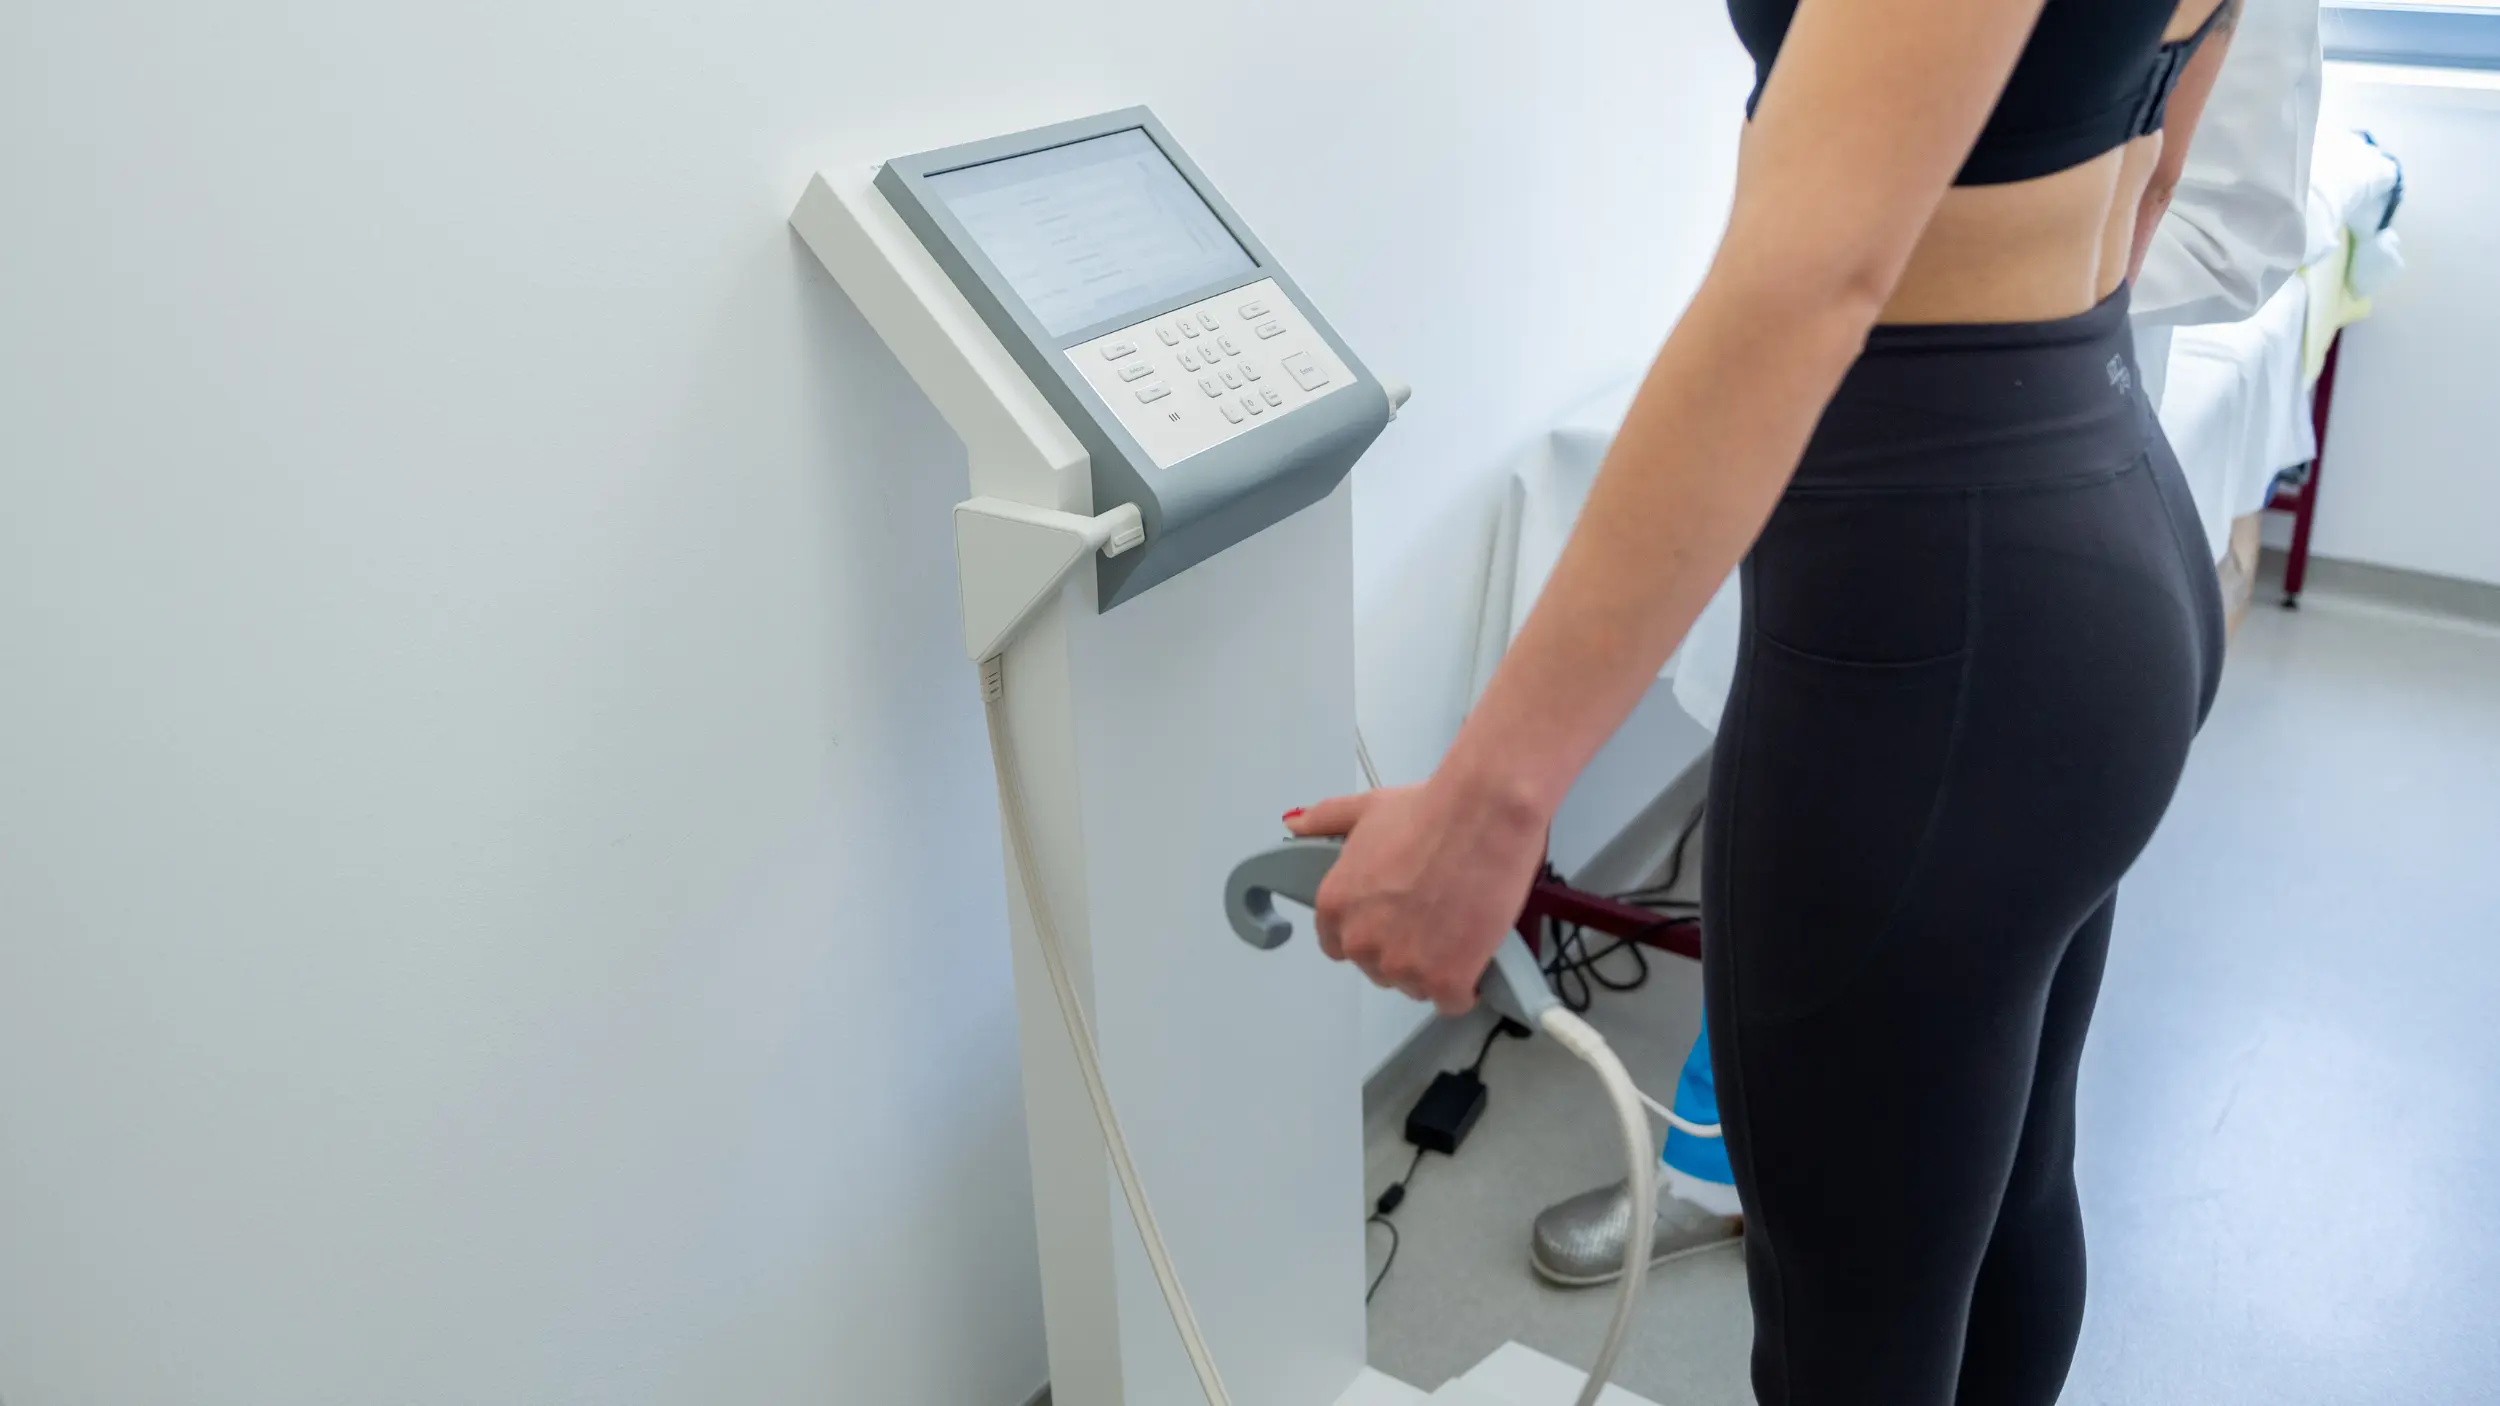
Let's talk about what an InBody scan actually is. This is a body composition analysis that uses bioelectrical impedance analysis (BIA) technology to measure the electrical conductivity of different tissues in your body [1]. You'll stand on a scale-like device and hold hand electrodes for about 60 seconds while painless electrical currents (you won't feel a thing) pass through your body.
Here's what makes this technology so valuable: different tissues conduct electricity at different rates. Muscle tissue, which contains more water and electrolytes, conducts electricity more efficiently than fat tissue [2]. The InBody device measures this resistance and uses sophisticated algorithms to calculate your body composition metrics.
What you'll see in your results:
- Total Body Water – Your intracellular and extracellular fluid levels, which can indicate hydration status and potential inflammation
- Dry Lean Mass – Your protein and mineral content, essential for understanding bone and tissue health
- Body Fat Mass – Total amount of fat tissue, broken down by body segment
- Skeletal Muscle Mass – The muscle you can actively build through strength training and proper nutrition
- Segmental Analysis – A breakdown showing exactly where your muscle and fat are distributed across your arms, legs, and trunk
The segmental muscle and fat analysis is honestly one of my favorite features. It shows you if you're carrying more muscle on one side versus the other (super common if you're right or left-hand dominant), or if you're holding onto stubborn fat in specific areas. This isn't about vanity—it's about understanding muscle imbalances that could affect your functional nutrition and energy levels and identifying health patterns.
Unlike a basic scale or even a body fat percentage measurement alone, an InBody scan gives you the why behind your weight. Two women can weigh exactly the same but have completely different body compositions—one might have significantly more muscle mass and less body fat, which dramatically affects metabolism, hormone balance, and overall health [3].
Decoding Your InBody Results: Turning Data into Action
Okay, you've got your InBody results printout in hand. Now what? Let me walk you through the key metrics and what they actually mean for your health.
Body Fat Percentage
This tells you what proportion of your total weight is fat tissue. For women ages 24-45, research suggests a healthy range typically falls between 21-33%, though this varies based on individual factors and athletic goals [4]. What matters more than hitting a specific number? The trend over time and how you feel.
- Below 21%: Often seen in athletes, but can affect hormone production and menstrual regularity if too low
- 21-25%: Athletic to fit range for most women
- 26-33%: Healthy range for the general population
- Above 33%: May increase risk for metabolic concerns, though body fat distribution matters significantly
Remember that body fat percentage alone doesn't tell the whole story. Where you carry fat matters tremendously for metabolic health. Visceral fat (around your organs) carries more health risk than subcutaneous fat (under your skin) [5].
Skeletal Muscle Mass
This metric shows the muscle you've built and can continue to develop. Higher skeletal muscle mass correlates with better metabolic health, improved insulin sensitivity, and stronger bones [6]. Your InBody results will compare your muscle mass to standard ranges for your height and weight.
If your skeletal muscle mass is below the standard range, don't panic. This is actually incredibly common, especially if you've been doing primarily cardio exercise or restricting calories significantly. We can absolutely build this back up with strategic strength training and adequate protein intake.
Basal Metabolic Rate (BMR)
Your BMR represents the calories your body burns at complete rest just to keep you alive—breathing, circulating blood, producing hormones, all the behind-the-scenes magic. The InBody calculates this based on your actual muscle mass, not just age and weight estimates [7].
This number is crucial for setting appropriate calorie targets. If your BMR is 1,400 calories and you've been eating 1,200 calories daily wondering why you're exhausted and not losing weight, we've found our answer. Your body needs adequate fuel to function, and chronic undereating can actually lower your metabolic rate over time.
Segmental Lean Analysis
Those little bar graphs showing your arms, legs, and trunk? They're comparing your muscle mass in each area to what's considered standard for your body. This is where we spot imbalances.
I frequently see women with underdeveloped upper body strength (totally normal in our culture where women often skip upper body training) or muscle asymmetries that could explain nagging aches or movement patterns. This data helps us create targeted strength training protocols.
Phase Angle
This is a more advanced metric that reflects your cellular health and integrity. A higher phase angle generally indicates healthier, more intact cell membranes and better overall cellular function [8]. For women, a phase angle above 5.4 degrees typically indicates good cellular health, though this increases with muscle mass.
Low phase angle readings might suggest chronic inflammation, overtraining, inadequate recovery, or nutritional deficiencies. If your phase angle is low, we'll look at supporting your gut health and microbiome alongside other interventions.
How an InBody Scan Can Support Your Health Goals
Let's get practical about how we actually use this data to move you forward.
For Weight Loss Goals
When you're working toward weight loss, the scale can be frustratingly misleading. You might be losing fat and gaining muscle simultaneously—incredible progress!—but the scale barely moves or even goes up slightly. An InBody scan cuts through that confusion by showing you exactly what's changing.
I worked with a client who lost only 4 pounds over three months but dropped 8 pounds of fat and gained 4 pounds of muscle. Her InBody results confirmed she was making phenomenal progress even though her scale weight suggested otherwise. This kept her motivated and validated that her nutrition and training protocol was working beautifully.
We can use your results to:
- Set a realistic calorie target based on your actual BMR and activity level
- Calculate your protein needs based on your current lean body mass (typically 0.7-1.0g per pound of lean mass for most women)
- Track fat loss specifically rather than just weight loss
- Adjust your plan if you're losing muscle along with fat (which we want to prevent)
For Muscle Building and Strength Goals
If you're trying to build muscle, regular InBody scans (every 8-12 weeks) provide objective evidence that your training and nutrition are effective. Building muscle requires a slight calorie surplus and adequate protein, and seeing those skeletal muscle mass numbers climb is incredibly validating [9].
The segmental analysis helps us identify which muscle groups need more attention. If your legs are developing nicely but your upper body is lagging, we know to adjust your training split accordingly.
For Athletic Performance
Athletes benefit enormously from tracking body composition changes across training seasons. We can monitor whether you're maintaining adequate muscle mass during endurance training phases or successfully building power during strength blocks.
The body water measurements also help identify potential overtraining or inadequate recovery. Elevated extracellular water relative to intracellular water can indicate inflammation or insufficient rest [10].
For Overall Health and Metabolic Wellness
Even if you don't have specific physique goals, understanding your body composition provides valuable health insights. Higher muscle mass is associated with better hormone balance, improved insulin sensitivity, stronger bones, and reduced risk of metabolic disease [11].
Women in their 30s and 40s naturally begin losing muscle mass if they're not actively working to maintain it. Regular body composition analysis helps us catch this early and implement strength training and nutrition strategies to preserve your metabolic health as you age.
Frequently Asked Questions
Q: How do I prepare for an InBody scan?
For the most accurate results, follow these guidelines:
- Maintain normal hydration the day before (don't overhydrate or underhydrate)
- Avoid eating or exercising for 2-3 hours before your scan
- Empty your bladder immediately before testing
- Avoid alcohol for 24 hours prior
- If you're menstruating, note that water retention may affect results slightly
- Remove jewelry, watches, and ensure your feet are clean and dry
Timing matters for consistency. If possible, schedule your scans at the same time of day under similar conditions to minimize variables between tests.
Q: Is an InBody scan safe?
Absolutely. The electrical currents used in bioelectrical impedance analysis are extremely low-level and completely painless—you won't feel anything during the test [12]. The technology has been validated in research settings and is considered safe for most people.
However, you should not use an InBody scan if you have an implanted electronic medical device like a pacemaker or defibrillator, as the electrical current could potentially interfere with the device.
Q: How often should I get an InBody scan?
For most women making lifestyle changes, I recommend scanning every 8-12 weeks. This gives your body enough time to show meaningful changes while keeping you accountable and motivated.
Scanning more frequently (like weekly) isn't particularly useful because normal fluctuations in hydration, menstrual cycle, and recent meals can affect results more than actual body composition changes in that short timeframe. We want to track trends, not daily noise.
If you're maintaining your current body composition and just checking in periodically, twice yearly scans work perfectly.
Ready to take the first step toward a deeper understanding of your health? Your body composition tells a story that your scale weight simply can't capture. Whether you're working toward fat loss, building strength, optimizing athletic performance, or simply understanding your metabolic health better, an InBody scan provides the data-driven insights we need to create a truly personalized plan.
Let's decode your results together and build a nutrition and training strategy based on your actual body composition, not generic recommendations. Book a consultation with me today and let's unlock the power of your InBody scan to help you reach your goals.
References
[1] Kyle UG, Bosaeus I, De Lorenzo AD, et al. Bioelectrical impedance analysis—part I: review of principles and methods. Clinical Nutrition, 2004.
[2] Kushner RF, Schoeller DA. Estimation of total body water by bioelectrical impedance analysis. American Journal of Clinical Nutrition, 1986.
[3] Srikanthan P, Karlamangla AS. Muscle mass index as a predictor of longevity in older adults. American Journal of Medicine, 2014.
[4] Gallagher D, Heymsfield SB, Heo M, et al. Healthy percentage body fat ranges: an approach for developing guidelines based on body mass index. American Journal of Clinical Nutrition, 2000.
[5] Neeland IJ, Ross R, Després JP, et al. Visceral and ectopic fat, atherosclerosis, and cardiometabolic disease: a position statement. The Lancet Diabetes & Endocrinology, 2019.
[6] Wolfe RR. The underappreciated role of muscle in health and disease. American Journal of Clinical Nutrition, 2006.
[7] Müller MJ, Bosy-Westphal A, Klaus S, et al. World Health Organization equations have shortcomings for predicting resting energy expenditure in persons from a modern, affluent population: generation of a new reference standard from a retrospective analysis of a German database of resting energy expenditure. American Journal of Clinical Nutrition, 2004.
[8] Norman K, Stobäus N, Pirlich M, Bosy-Westphal A. Bioelectrical phase angle and impedance vector analysis—clinical relevance and applicability of impedance parameters. Clinical Nutrition, 2012.
[9] Morton RW, Murphy KT, McKellar SR, et al. A systematic review, meta-analysis and meta-regression of the effect of protein supplementation on resistance training-induced gains in muscle mass and strength in healthy adults. British Journal of Sports Medicine, 2018.
[10] Pollastri L, Lanfranconi F, Tredici G, et al. Body water status and short-term maximal power output during a multistage road bicycle race. International Journal of Sports Medicine, 2016.
[11] Srikanthan P, Hevener AL, Karlamangla AS. Sarcopenia exacerbates obesity-associated insulin resistance and dysglycemia: findings from the National Health and Nutrition Examination Survey III. PLoS One, 2010.
[12] Thomas DM, Bredlau C, Bosy-Westphal A, et al. Relationships between body roundness with body fat and visceral adipose tissue emerging from a new geometrical model. Obesity, 2013.
.svg)
.svg)






.jpg)
.jpg)




















.webp)































.webp)
.webp)
.webp)
.webp)
.webp)
.webp)
.webp)
.png)
.webp)
.webp)

.webp)
.png)
.webp)
.webp)
.webp)
.webp)
.webp)
.webp)
.webp)
.webp)
.webp)



.webp)
.png)